Showing posts with label US Geological Survey. Show all posts

Wednesday, August 24, 2011

Hydrofracking May Be Leading to Increased Seismic Activity


(The above map is of locations of shale gas resources in the continental United States. I have not found a comprehensive map of active drilling sites.)

With the Virginia earthquake of August 23, 2011, people have wondered whether increased hydrofracking could be leading to increased seismic activity.

NPR's affiliate WNYC ran a story today which reported:
Research has found links between hydrofracking and increased seismic activity. The United States Geological Survey said it's possible for humans to cause earthquakes through such activities. The USGS wrote in its "Earthquakes, Faults, Plate Tectonics, Earth Structure" FAQ that "Earthquakes induced by human activity have been documented in a few locations in the United States, Japan, and Canada. The cause was injection of fluids into deep wells for waste disposal and secondary recovery of oil, and the use of reservoirs for water supplies."

A member of the British Geological Survey has offered a similar opinion about the possible link between hydrofracking and earthquakes in Lancashire: Brian Baptie of the United Kingdom survey said, "It seems quite likely that they are related."

See also the blogpost "Is Fracking In The UK Causing Earthquakes?" at DeSmogBlog.com.

Could hydrofracking in the nearby Marcellus Shale and the Utica Shale Regions be the cause of the up-tick in earthquake activity in the Virginia Seismic Zone? This matter deserves scrutiny. I am not holding my breath. We are living in an era of a COPS (corporate-owned political system).

Tuesday, August 23, 2011

Search for 8/23 earthquake intensity for your ZIP Code; ramifications for nuclear plant considerations

PBS News Hour "The Rundown Blog" has a link to a U.S. Geological Survey search engine for the August 23, 2011 earthquake (now reported as 5.8) intensity at various East Coast locations.

Enter a zip code to see how intense the earthquake was for particular locations.
The search engine returns a figure to indicate quake intensity.

(One problem: the intensity numbers are given in Arabic numerals. Yet the cited magnitude scale on the page is not the Richter Scale, but the Modified Mercalli Intensity Scale, which is given in Roman numerals. The USGS site says that it is not giving quake intensity in Richter measurements, yet it is not saying which scale the indicated numbers match to.)

QUAKE PATTERN RELEVANCE FOR DISCUSSIONS OF NUCLEAR PLANT VULNERABILITY
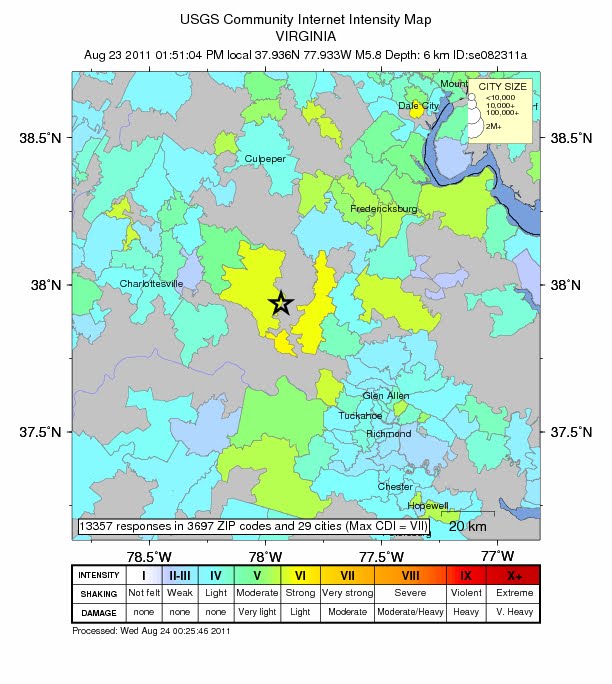
One might argue that the quake could not harm distant locations if it did not affect closer locations. Yet if one looks at the map of the intensity readings for the quake one sees that the clusters of earthquake strength are not clustered in a continuous pattern next to the Mineral, Virginia epicenter. Some places have light or negligible vibrations from the earthquake tremors. Yet, a distance further away did record strong quake readings.
See for your self from the map immediately below. (The trajectory of the quake from Mineral, Virginia, northeast-ward toward lower New England appears to follow along the Ramapo Fault.
Other references to the Ramapo Fault:
http://www.wnyc.org/blogs/wnyc-news-blog/2011/mar/14/look-tri-states-active-fault-line/
http://slatest.slate.com/posts/2011/08/23/east_coast_fault_lines_virginia_earthquake_highlights_significan.html


Here is a closer view of the map of the Mineral, Louisa County, Virginia area of the earthquake.