This morning, October 30, 2012, comes the news that a levee has broken in North Bergen, Hudson County, New Jersey.
This levee breach affects Little Ferry and Moonachie. Little Ferry is adjacent to the Hackensack River.
The Tappan Zee bridge over the Hudson River has reopened.
Some New York City bridges, including the East River bridges, have reopened.

Showing posts with label extreme weather. Show all posts
Showing posts with label extreme weather. Show all posts
Tuesday, October 30, 2012


Monday, October 29, 2012
11 am 10/29 update: LATEST Hurricane Sandy maps, evacuation, other details
Track the Hurricane Sandy storm live with maps.
BREAKING - HURRICANE SANDY IS AT 86 MILES PER HOUR (MPH), 9 DEGREES SHORT OF SAFFIR CATEGORY 2 - IS MOVING AT 20 MPH, 205 MILES SE OF ATLANTIC CITY, NJ

The projected path of Hurricane Sandy, as projected at 11:00 am EDT, Monday, October 29, 2012.
Storm tracking details at Reuters, Tracking Storm Sandy, as of 11:00 am Monday, October 29, 2012: Latest information on Hurricane Sandy (as of 11 am EDT):
• LOCATION: 37.5N 71.5W (205 miles southeast of Atlantic City, NJ and 260 miles South/Southeast of NYC)
• WIND: Max sustained winds at 90 miles per hour (150 km/h)
• MOVING: North/Northwest at 18 MPH (30km/h)
• BULLETIN: Click to read the full National Hurricane Center bulletin
[Source: National Hurricane Center, as of 11:00 A.M. ET Monnday]
Resources: Track Hurricane Sandy with our targeted Twitter List
NYC evacuation zones, ordered per mayor Michael Bloomberg
by matthew.keys edited by anthony.derosa 11:51 AM, 10/28/12

Thanks to WNYC for map of the Zone A, zone B, zone C New York City evacuation map. It includes evacuation centers.
New York City mayor Michael Bloomberg declares mandatory emergency evacuation zones; orders New York City schools to close, in 11:30 am Sunday news conference.
Zone A areas mandatory to be evacuated to include City Island, the coast of the Lower East Side, the Battery, South Street section, parts of Long Island City and Greenpoint surrounding Newtown Creek, Red Hook, the western, southern and eastern shores of Staten Island, all of Coney Island, all of the Rockaway Peninisula of Queens. Click on the map to get a closer view of zones.
*NATIONAL: VISIT READY.GOV for making a plan and packing a go kit.
*DELAWARE: Governor Markell declares a 'Level 2 Driving Restriction' provides that no person shall operate a motor vehicle on Delaware roadways other than essential personnel. 'Essential personnel' includes those employees necessary to maintain the core functions of government and maintain health and safety by providing utility services, healthcare services, and food and fuel deliveries.
*LONG ISLAND (NASSAU COUNTY, SUFFOLK COUNTY) EVACUATIONS, EMERGENCY MEASURES
Click to this site at North Fork Patch site.
*MARYLAND EVACUATION INFORMATION
Baltimore Sun: Ocean City mandatory evacuation of city's southernmost blockas, but some choose to remain.
*NEW JERSEY EVACUATION INFORMATION
*PENNSYLVANIA: SEPTA suspends services. Flights in, out of Philadelphia Int'l Airport cancelled for Monday. Pres. Obama approves governor's state of emergency.
AFL-CIO Community Services blog with FEMA and American Red Cross links
AlterNet: Combining weather conditions make Hurricane Sandy a Frankenstorm.
From Democracy Now: Hurricane Sandy kills 21 in the Caribbean
AFTER THE MAPS, Cultural impacts of Hurricane Sandy
As of 9:20 AM, Saturday, October 27, 2012, Hurricane Sandy remains a Category 1 storm. The northern tip of the storm is off Kitty Hawk, North Carolina, and the southern end is off the coast of Palm Beach Gardens, Florida. It is currently making landfall from Kitty Hawk, down to Hilton Head, South Carolina. Much of the eastern interior of the Carolinas is affected by the rain.
Weather Underground's (wunderground.com) Wundermap
The Weather Channel's Weather.com's classic map
The Weather Channel's Weather.com's interactive map
Wunderground Maps using NOAA'S SLOSH (Sea, Lake, and Overland Surge from Hurricanes) storm surge projection models
Weather Underground Georgia, Carolinas Storm Surge Model Maps, for the four Saffir-Simpson Hurricane Wind Scales
Weather Underground Middle Atlantic (VA, MD, DE, NJ, NY) Storm Surge Model Maps
Weather Underground New England (CT, RI, MA, NH, ME) Storm Surge Model Maps
First major property casualties:
 Downtown Atlantic City, New Jersey flooded: (Twitter.com/hoeboma)
Eastern pier, off Ocean City, MD boardwalk is lost. (WGMD radio, Rehoboth Beach, DE)
Cultural impacts of Hurricane Sandy
It is projected to hit New England and New York State on Halloween or the day before. The storm will have resolved prior to the final weekend before the 2012 presidential and general election.
In this writer's eyes, the Huffington Post is being unnecessarily alarmist with its Reuters story headlined, "Hurricane Sandy Threatens U.S. Presidential Campaign." Voters in the swing states of Virginia, North Carolina and Florida will have had their fill of campaign attention by this weekend. Additionally, the storm has skipped the Florida coast, so the Barack Obama and Mitt Romney campaigns can safely campaign there without fear of paltry crowds.
The storm could benefit Democrats as the storm moves the global warming discussion from theory to actual illustration. Additionally, all the cleanup and emergency assistance would be illustrations of positive government in action. However, there are the significant numbers of voters that cognitively fail to connect these actions to discussions of the worth of the role of government investment and spending.
More acutely, observers in Maryland are considering whether the storm will affect early voting in that state, Pikesville Patch reports.
BREAKING - HURRICANE SANDY IS AT 86 MILES PER HOUR (MPH), 9 DEGREES SHORT OF SAFFIR CATEGORY 2 - IS MOVING AT 20 MPH, 205 MILES SE OF ATLANTIC CITY, NJ

The projected path of Hurricane Sandy, as projected at 11:00 am EDT, Monday, October 29, 2012.
Storm tracking details at Reuters, Tracking Storm Sandy, as of 11:00 am Monday, October 29, 2012: Latest information on Hurricane Sandy (as of 11 am EDT):
• LOCATION: 37.5N 71.5W (205 miles southeast of Atlantic City, NJ and 260 miles South/Southeast of NYC)
• WIND: Max sustained winds at 90 miles per hour (150 km/h)
• MOVING: North/Northwest at 18 MPH (30km/h)
• BULLETIN: Click to read the full National Hurricane Center bulletin
[Source: National Hurricane Center, as of 11:00 A.M. ET Monnday]
Resources: Track Hurricane Sandy with our targeted Twitter List
NYC evacuation zones, ordered per mayor Michael Bloomberg
by matthew.keys edited by anthony.derosa 11:51 AM, 10/28/12

Thanks to WNYC for map of the Zone A, zone B, zone C New York City evacuation map. It includes evacuation centers.
New York City mayor Michael Bloomberg declares mandatory emergency evacuation zones; orders New York City schools to close, in 11:30 am Sunday news conference.
Zone A areas mandatory to be evacuated to include City Island, the coast of the Lower East Side, the Battery, South Street section, parts of Long Island City and Greenpoint surrounding Newtown Creek, Red Hook, the western, southern and eastern shores of Staten Island, all of Coney Island, all of the Rockaway Peninisula of Queens. Click on the map to get a closer view of zones.
*NATIONAL: VISIT READY.GOV for making a plan and packing a go kit.
*DELAWARE: Governor Markell declares a 'Level 2 Driving Restriction' provides that no person shall operate a motor vehicle on Delaware roadways other than essential personnel. 'Essential personnel' includes those employees necessary to maintain the core functions of government and maintain health and safety by providing utility services, healthcare services, and food and fuel deliveries.
*LONG ISLAND (NASSAU COUNTY, SUFFOLK COUNTY) EVACUATIONS, EMERGENCY MEASURES
Click to this site at North Fork Patch site.
*MARYLAND EVACUATION INFORMATION
Baltimore Sun: Ocean City mandatory evacuation of city's southernmost blockas, but some choose to remain.
*NEW JERSEY EVACUATION INFORMATION
*PENNSYLVANIA: SEPTA suspends services. Flights in, out of Philadelphia Int'l Airport cancelled for Monday. Pres. Obama approves governor's state of emergency.
AFL-CIO Community Services blog with FEMA and American Red Cross links
AlterNet: Combining weather conditions make Hurricane Sandy a Frankenstorm.
From Democracy Now: Hurricane Sandy kills 21 in the Caribbean
AFTER THE MAPS, Cultural impacts of Hurricane Sandy
As of 9:20 AM, Saturday, October 27, 2012, Hurricane Sandy remains a Category 1 storm. The northern tip of the storm is off Kitty Hawk, North Carolina, and the southern end is off the coast of Palm Beach Gardens, Florida. It is currently making landfall from Kitty Hawk, down to Hilton Head, South Carolina. Much of the eastern interior of the Carolinas is affected by the rain.
Weather Underground's (wunderground.com) Wundermap
The Weather Channel's Weather.com's classic map
The Weather Channel's Weather.com's interactive map
Wunderground Maps using NOAA'S SLOSH (Sea, Lake, and Overland Surge from Hurricanes) storm surge projection models
Weather Underground Georgia, Carolinas Storm Surge Model Maps, for the four Saffir-Simpson Hurricane Wind Scales
Weather Underground Middle Atlantic (VA, MD, DE, NJ, NY) Storm Surge Model Maps
Weather Underground New England (CT, RI, MA, NH, ME) Storm Surge Model Maps
First major property casualties:

Eastern pier, off Ocean City, MD boardwalk is lost. (WGMD radio, Rehoboth Beach, DE)
Cultural impacts of Hurricane Sandy
It is projected to hit New England and New York State on Halloween or the day before. The storm will have resolved prior to the final weekend before the 2012 presidential and general election.
In this writer's eyes, the Huffington Post is being unnecessarily alarmist with its Reuters story headlined, "Hurricane Sandy Threatens U.S. Presidential Campaign." Voters in the swing states of Virginia, North Carolina and Florida will have had their fill of campaign attention by this weekend. Additionally, the storm has skipped the Florida coast, so the Barack Obama and Mitt Romney campaigns can safely campaign there without fear of paltry crowds.
The storm could benefit Democrats as the storm moves the global warming discussion from theory to actual illustration. Additionally, all the cleanup and emergency assistance would be illustrations of positive government in action. However, there are the significant numbers of voters that cognitively fail to connect these actions to discussions of the worth of the role of government investment and spending.
More acutely, observers in Maryland are considering whether the storm will affect early voting in that state, Pikesville Patch reports.
Updated Frankenstorm or Hurricane Sandy images


Fixed over the North Atlantic Ocean, poised to strike New Jersey in hours. West Virginia forecast to get two FEET, yes, that's feet of SNOW.
Wednesday, September 7, 2011
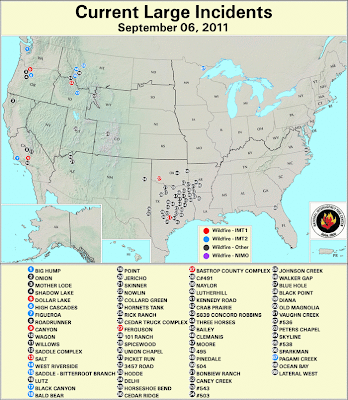
Map: Fire Saturation of East Texas; Approaching neighboring states
Map of the concentration of wildfires in East Texas.
National map with fires in Texas and other areas cluster fo fires now approaching southeastern Oklahoma, southwestern Arkansas (Texarkana vicinity) and Louisiana (Shreveport vicinity):
"Active Fire Mapping Program" with "Current Large Incidents," as of September 6, 2011:
http://activefiremaps.fs.fed.us/
Guide to terms used, e.g., Incident Management Team:
http://en.wikipedia.org/wiki/Incident_management_team
National map with fires in Texas and other areas cluster fo fires now approaching southeastern Oklahoma, southwestern Arkansas (Texarkana vicinity) and Louisiana (Shreveport vicinity):
"Active Fire Mapping Program" with "Current Large Incidents," as of September 6, 2011:
http://activefiremaps.fs.fed.us/

Guide to terms used, e.g., Incident Management Team:
http://en.wikipedia.org/wiki/Incident_management_team
Monday, September 5, 2011
Here we go again (Latest Maps): Projected 5 day Hurricane Katia storm path & times - Storm upgraded
Just on the last weekend of August, 2011 much of the United States east coast was struck by the strongest hurricane since perhaps 1960 with Hurricane Donna.
Another hurricane, Hurricane Katia, is set to strike the continental United States in this coming week. Scroll to bottom for NOAA satellite maps and 5-day Hurricane Katia path forecast

Click to this site, IrishWeatherOnline, for illustrated maps and satellite maps of the storm's presnet location and its projected path. (Mark Dunphy, "Hurricane Katia Monday Update – Satellite Imagery And Projected Track", September 5, 2011.)
Maps at the site indicate a projected are of the hurricane's striking the U.S. as being from South Carolina, north to North Carolina, Virginia, Maryland, Delaware and New Jersey.
Several more MAPS at the bottom of this post, including map with hurricane path timeline.
It is projected to reach a Saffir-Simpson Category 2 hurricane.


Another hurricane, Hurricane Katia, is set to strike the continental United States in this coming week. Scroll to bottom for NOAA satellite maps and 5-day Hurricane Katia path forecast

Click to this site, IrishWeatherOnline, for illustrated maps and satellite maps of the storm's presnet location and its projected path. (Mark Dunphy, "Hurricane Katia Monday Update – Satellite Imagery And Projected Track", September 5, 2011.)
Maps at the site indicate a projected are of the hurricane's striking the U.S. as being from South Carolina, north to North Carolina, Virginia, Maryland, Delaware and New Jersey.
Several more MAPS at the bottom of this post, including map with hurricane path timeline.
It is projected to reach a Saffir-Simpson Category 2 hurricane.
Maximum sustained winds of Katia have increased to 105 miles (165 kilometers) per hour, with higher gusts, making it a category two hurricane on the five-step Saffir-Simpson scale of intensity. Further strengthening is expected on Monday.Yet, Hurricane Katia is projected to moderate once it reaches landfall:
Meanwhile, there is a small risk that the remnants of Hurricane Katia could threaten parts of the eastern Atlantic in 8-9 days time.The following satellite maps are Sept. 4, 20:15 UTC-Greenwich Mean Time (5:15 PM EST), and Sept. 4, 20:45 UTC-Greenwich Mean Time (5:45 PM EST)


Wednesday, August 31, 2011
Obama calls out GOP for Holding FEMA Funds Hostage
The House Republicans are refusing to give more money to the Federal Emergency Management Agency or FEMA.
(This is a particularly big issue right now, since the money could be of great used for helping the people that are suffering from the effects of Hurricane Irene, and FEMA has run out of money. Of course it has run out of money: this year has seen so much extreme weather, and we have four months to go in the remainder of 2011.)
So, it was quite proper when President Barack Obama criticized the GOP for holding FEMA funds hostage.
Los Angeles Times: White House blasts GOP over FEMA funding".
Now, one wonders whether some middle of the road voters in flood besieged New Jersey will reconsider support for Republican congressional or presidential candidates. Just consider how the supposedly moderate N.J. Governor Chris Christie has taken the state out of the Northeast carbon cap compact.
Will weather disaster-plagued districts flip from Republican to Democratic in the Presidential and Congressional votes in the 2012 general election? Just note (on the 2010 Congressional elections map below) the red district from northeastern North Carolina to New Jersey. Will voters see the light about global warming (as opposed to deniers Rick Perry and Chris Christie?

Well, maybe it will take more 100 degree days and destructive hurricanes. Click on this link for "Natural disaster risk assessment reveals most and least dangerous cities" at AgentGenius.com for natural disaster risk. The very Republican red Southeast has the most cities that are indicated to be the riskiest in which to live.
(This is a particularly big issue right now, since the money could be of great used for helping the people that are suffering from the effects of Hurricane Irene, and FEMA has run out of money. Of course it has run out of money: this year has seen so much extreme weather, and we have four months to go in the remainder of 2011.)
So, it was quite proper when President Barack Obama criticized the GOP for holding FEMA funds hostage.
Los Angeles Times: White House blasts GOP over FEMA funding".
Now, one wonders whether some middle of the road voters in flood besieged New Jersey will reconsider support for Republican congressional or presidential candidates. Just consider how the supposedly moderate N.J. Governor Chris Christie has taken the state out of the Northeast carbon cap compact.
Will weather disaster-plagued districts flip from Republican to Democratic in the Presidential and Congressional votes in the 2012 general election? Just note (on the 2010 Congressional elections map below) the red district from northeastern North Carolina to New Jersey. Will voters see the light about global warming (as opposed to deniers Rick Perry and Chris Christie?

Well, maybe it will take more 100 degree days and destructive hurricanes. Click on this link for "Natural disaster risk assessment reveals most and least dangerous cities" at AgentGenius.com for natural disaster risk. The very Republican red Southeast has the most cities that are indicated to be the riskiest in which to live.
Tuesday, August 30, 2011
8/30, PM UPDATES: Airlifts to Vermont; Irene Deaths: 41; 2.85 Million People w/o Power; In NJ: Flooding Remains
TUESDAY, 8/30/11 UPDATES:
Isolated flood-besieged Vermont towns are receiving supplies by way of National Guard airlifts: Newport News Daily Press: "National Guard airlifts take food, water to Vt. towns cut off by Irene's flooding."
(There's the helpful hand of the national government. Think about that one, Tea-Partiers. Army Corp of Engineers, FEMA, those are federal agency helping the public, tax dollars at work.)
CNN reports that the death toll from Hurricane Irene now stands at 41: "Irene update: Death toll at 41; 2.85 million still without power."
Flooding of rivers in the Passaic River Basin is affecting towns throughout northern New Jersey, covering streets, flooding homes. (Reuters)
Most of eastern Connecticut remains without power. (Wall Street Journal)
Isolated flood-besieged Vermont towns are receiving supplies by way of National Guard airlifts: Newport News Daily Press: "National Guard airlifts take food, water to Vt. towns cut off by Irene's flooding."
(There's the helpful hand of the national government. Think about that one, Tea-Partiers. Army Corp of Engineers, FEMA, those are federal agency helping the public, tax dollars at work.)
CNN reports that the death toll from Hurricane Irene now stands at 41: "Irene update: Death toll at 41; 2.85 million still without power."
Flooding of rivers in the Passaic River Basin is affecting towns throughout northern New Jersey, covering streets, flooding homes. (Reuters)
Most of eastern Connecticut remains without power. (Wall Street Journal)
Big Tar Sands Sit-in Protests at White House -Will Obama Listen?
Interesting timing that global warming protests at the White House were scheduled for a week right after Hurricane Irene, the largest Mid-Atlantic and New England --very convenient, and pertinent.
140 protesters were outside the White House on August 29, 2011, submitting to arrest. (Today is day 10 of a two-week protest.) They were protesting against Keystone's Tar Sands pipeline from Alberta, Canada to Texas, U.S. As an opponent of the pipeline noted, we have seen an increasing number of episodes of extreme weather.
Now, albeit, a single incident of extreme weather does not always indicate an effect of global warming. Take for example, the cycle of large hurricanes hitting the New York City/ Long Island region in recent decades, 1938, 1960, 1985, 2011. In the cycle we have hurricanes coming about every 25 years. And, the scientific consensus is that we cannot we identify a causal relationship of global warming upon tornadoes.
But, in aggregate, we are seeing more days of very high temperatures, weeks of 90s, 100s degree temperatures from Texas to Florida. And we are seeing severity of weather patterns in certain parts of the country: in the Southwest and Mountain West: drought and wildfires; and in much of the rest of the continental U.S.: record rainfalls.
WHAT IS THE TAR SANDS PIPELINE PROJECT?
There is much oil in Alberta, Canada. The United States has a high appetite for fossil fuels. Transcanada, is building the Keystone Pipeline to carry diluted bitumen, a crude oil, from there to the Gulf of Mexico in Texas. Proponents of the project say that the oil from the project will help ween the United States off its dependence on foreign oil (often pundits mention the Middle East, but they omit Nigeria, Mexico and Venezuela).
You can watch a short debate between an opponent and a proponent of the pipeline on the PBS News Hour show of August 29. Here, below, is a map of the pipeline's projected route. (Note its path through several red states and to Rick Perry's Texas. Watch Governor Perry gloat over the money that it brings through the state and ignore Obama's role in the pipeline.)

Read more background on the Keystone Project at PBS News Hour's Rundown blog, "Proposed Tar Sands Oil Pipeline Elicits Protests."
Then again, consider the above mentioned signs of worsening weather, the melting of glaciers, and the international scientific consensus: we are experiencing global warming, and humans ARE causing this.
We should be investing in renewable energies: wind, solar, corn-based ethanol. We should be shifting from investments in roads and airports to inter-city trains, and for regional population clusters, high speed rail. We should be developing residential and work communities in compact arrangements, similar to the patterns that we see in the older cities of the Mid-West and the Northeast. The judgment behind this pipeline proposal is questionable.
Protesters were calling on President Barack Obama to take action to stop the project. Specifically, they want Obama to deny a permit to the project. Details, see "NW environmental news: Oil sand pipeline in the crosshairs of activists", at OregonLive.com, August 29, 2011.
The organized opposition has been going for two years now. The current protest has given the story more legs. At earlier this month, Daily Kos ran this post with an online petition to Obama to stop the pipeline.
NASA'S JAMES HANSEN'S CRITICISMS
Number 112 of the 140 arrested today at the White House was James Hansen, the head of the NASA Goddard Institute for Space Studies in New York, New York. Elizabeth McGowan in "Amid Cheers, NASA Chief Is Arrested at Oil Sands Pipeline Protests: James Hansen, the 70-year-old renowned climate scientist, was the 112th of 140 arrested on day 10 of the Keystone XL pipeline sit-ins", wrote:
WILL PRESIDENT OBAMA BE MOVED?
Given that President Obama is heeding the prerogatives of the Corporate Occupied Political System, the odds are very slim that he would to anything to oppose this project. His record in the past two years has shown that he attends to the interests of corporations. Plus, he's got the Tea-Party Republicans, such as Rep. Michele Bachmann breathing down his neck to keep oil prices down. My prediction, despite any protests, Obama will be more concerned with satisfying vehicle drivers that want low gas prices. Despite the protests, Obama will not deny the pipeline project a permit. He will play to the middle and show himself to be the centrist that he is.
140 protesters were outside the White House on August 29, 2011, submitting to arrest. (Today is day 10 of a two-week protest.) They were protesting against Keystone's Tar Sands pipeline from Alberta, Canada to Texas, U.S. As an opponent of the pipeline noted, we have seen an increasing number of episodes of extreme weather.
Now, albeit, a single incident of extreme weather does not always indicate an effect of global warming. Take for example, the cycle of large hurricanes hitting the New York City/ Long Island region in recent decades, 1938, 1960, 1985, 2011. In the cycle we have hurricanes coming about every 25 years. And, the scientific consensus is that we cannot we identify a causal relationship of global warming upon tornadoes.
But, in aggregate, we are seeing more days of very high temperatures, weeks of 90s, 100s degree temperatures from Texas to Florida. And we are seeing severity of weather patterns in certain parts of the country: in the Southwest and Mountain West: drought and wildfires; and in much of the rest of the continental U.S.: record rainfalls.
WHAT IS THE TAR SANDS PIPELINE PROJECT?
There is much oil in Alberta, Canada. The United States has a high appetite for fossil fuels. Transcanada, is building the Keystone Pipeline to carry diluted bitumen, a crude oil, from there to the Gulf of Mexico in Texas. Proponents of the project say that the oil from the project will help ween the United States off its dependence on foreign oil (often pundits mention the Middle East, but they omit Nigeria, Mexico and Venezuela).
You can watch a short debate between an opponent and a proponent of the pipeline on the PBS News Hour show of August 29. Here, below, is a map of the pipeline's projected route. (Note its path through several red states and to Rick Perry's Texas. Watch Governor Perry gloat over the money that it brings through the state and ignore Obama's role in the pipeline.)

Read more background on the Keystone Project at PBS News Hour's Rundown blog, "Proposed Tar Sands Oil Pipeline Elicits Protests."
Then again, consider the above mentioned signs of worsening weather, the melting of glaciers, and the international scientific consensus: we are experiencing global warming, and humans ARE causing this.
We should be investing in renewable energies: wind, solar, corn-based ethanol. We should be shifting from investments in roads and airports to inter-city trains, and for regional population clusters, high speed rail. We should be developing residential and work communities in compact arrangements, similar to the patterns that we see in the older cities of the Mid-West and the Northeast. The judgment behind this pipeline proposal is questionable.
Protesters were calling on President Barack Obama to take action to stop the project. Specifically, they want Obama to deny a permit to the project. Details, see "NW environmental news: Oil sand pipeline in the crosshairs of activists", at OregonLive.com, August 29, 2011.
The organized opposition has been going for two years now. The current protest has given the story more legs. At earlier this month, Daily Kos ran this post with an online petition to Obama to stop the pipeline.
NASA'S JAMES HANSEN'S CRITICISMS
Number 112 of the 140 arrested today at the White House was James Hansen, the head of the NASA Goddard Institute for Space Studies in New York, New York. Elizabeth McGowan in "Amid Cheers, NASA Chief Is Arrested at Oil Sands Pipeline Protests: James Hansen, the 70-year-old renowned climate scientist, was the 112th of 140 arrested on day 10 of the Keystone XL pipeline sit-ins", wrote:
Hansen—who has been arrested a couple of times before for protesting the harvesting of fossil fuels—regularly criticizes the Keystone XL pipeline as the "fuse to the biggest carbon bomb on the planet." The Obama administration is expected to issue a decision on the international project by the end of the year.
WILL PRESIDENT OBAMA BE MOVED?
Given that President Obama is heeding the prerogatives of the Corporate Occupied Political System, the odds are very slim that he would to anything to oppose this project. His record in the past two years has shown that he attends to the interests of corporations. Plus, he's got the Tea-Party Republicans, such as Rep. Michele Bachmann breathing down his neck to keep oil prices down. My prediction, despite any protests, Obama will be more concerned with satisfying vehicle drivers that want low gas prices. Despite the protests, Obama will not deny the pipeline project a permit. He will play to the middle and show himself to be the centrist that he is.
Friday, August 26, 2011
Hurricane Irene tracking map and NYC projected flood risk map
PBS News Hour's color coded map of Hurricane Irene's East Coast / Atlantic Ocean path. Drag the second map to reach your section of the Atlantic coast. The first map is for use with Google Earth. It pulls from NOAA and similar agencies.
National Oceanic and Atmospheric Administration (NOAA) NOAA Family Disaster Plan tips:
http://www.nhc.noaa.gov/HAW2/english/prepare/family_plan.shtml
IN NEW YORK CITY:
The MTA Transit and Bus system will shut down at 12PM (noon) Saturday, August 27.
MAPS:
NY1's zoom-capable and downloadable PDF map of New York City Area A, Area B, Area C flood zones and the five boroughs' evacuation centers.
Here is WNYC.org's map of New York City with Area A, Area B, Area C, indicating which areas fall into these flood risk categories. A: area deeply affected by Category 1 storm, B: by Category 2 or 3 storm, C: by 3 or 4 and beyond.
* * *
The last big hurricanes in the New York City area:
Hurricane Gloria, 1985 (Initially Category 4, but it weakened by the time that it reached the Mid-Atlantic states)
Hurricane Donna, 1960 (Category 3 for the period that it was in the Atlantic Basin, off the Atlantic coast; longest storm to retain hurricane status --nine days)
* * *
"Why Animals Sense Natural Disasters Ahead of Time.
National Oceanic and Atmospheric Administration (NOAA) NOAA Family Disaster Plan tips:
http://www.nhc.noaa.gov/HAW2/english/prepare/family_plan.shtml
IN NEW YORK CITY:
The MTA Transit and Bus system will shut down at 12PM (noon) Saturday, August 27.
MAPS:
NY1's zoom-capable and downloadable PDF map of New York City Area A, Area B, Area C flood zones and the five boroughs' evacuation centers.
Here is WNYC.org's map of New York City with Area A, Area B, Area C, indicating which areas fall into these flood risk categories. A: area deeply affected by Category 1 storm, B: by Category 2 or 3 storm, C: by 3 or 4 and beyond.
* * *
The last big hurricanes in the New York City area:
Hurricane Gloria, 1985 (Initially Category 4, but it weakened by the time that it reached the Mid-Atlantic states)
Hurricane Donna, 1960 (Category 3 for the period that it was in the Atlantic Basin, off the Atlantic coast; longest storm to retain hurricane status --nine days)
* * *
"Why Animals Sense Natural Disasters Ahead of Time.
Subscribe to:
Posts (Atom)


 Posts
Posts


